Look at some of the highs and lows of US Securities for Q1 and Q2 2022.
Highlights:
- The S&P 500 decreased by -4.6% in Q1
- Q1 2022 Market Cap: Large Caps (-4.6%) outperformed Mid (-4.9%) and Small Caps (-7.5%).
- HFRI Equity Hedge (Total) Index detracted -3.86% over Q1 2022
- HFRI Fund of Funds Composite Index detracted -2.70% in Q1 2022
- Investors pulled $32B from hedge funds in Q2 2022
- Q2 2022 Sector: All eleven sectors were negative
- Q2 2022 Style: Value (Russell 1000 Value: -12.2%) exceeded Growth (Russell 1000 Growth: -20.9%)
Quarter 1 2022
Russia’s invasion of Ukraine in late February caused a global shock. Global equities declined and bond yields rose. Commodity prices soared given Russia is a key producer of oil, gas, and wheat, which further lead to a surge in inflation as well as supply chain disruption. Elsewhere, Chinese equities were negatively affected by renewed Covid-19 outbreaks, leading to new lockdowns in some major cities.
US in the first quarter of 2022
US stocks declined in Q1. Energy, Metals, & Agriculture commodities continued to surge at a historic pace, as the West imposed strict sanctions on Russia’s economy and central bank.

Soaring rates had the greatest negative impact on long-duration Growth stocks. In Q1, the large-cap Russell 1000 Value Index outperformed the Russell 1000 Growth Index by more than eight percentage points, while the small-cap Russell 2000 Value Index outperformed the Russell 2000 Growth Index by more than 10 percentage points. For the large-cap indices, this is Value’s strongest outperformance over Growth since the 2000 – 2002 era.
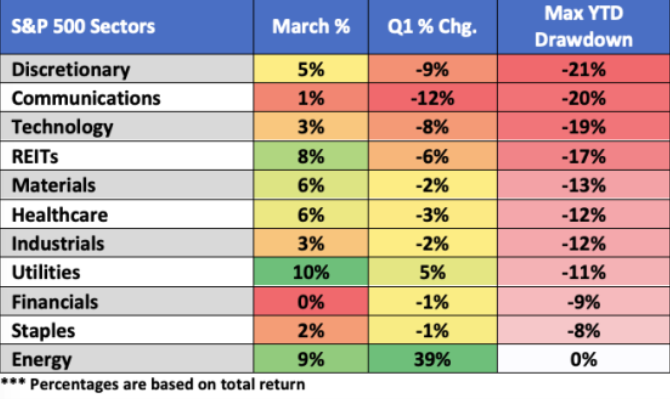
At the end of March 2022, 10 out of 11 sectors finished in red. Energy (+39%) had its best quarter since its inception in 1989 on the back of soaring oil and gas prices. Energy and utility companies were amongst the strongest performers in relative terms over the month, outperforming a falling market with modest gains. Technology, communication services, and consumer discretionary were amongst the weakest sectors.

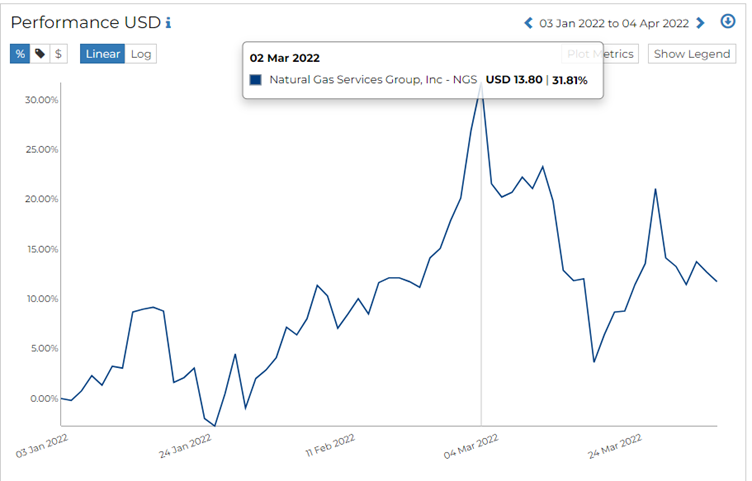
The Bloomberg Commodity Index (BCOM) advanced 25% in Q1 of 2022. At its high in early March, the BCOM Index gained 42% YTD for its biggest quarterly advance since 1973. Other meaningful commodity gains in Q1 include natural gas (+61%), nickel (+55%), iron ore (+39%), wheat (30%), corn (+26%), aluminum (+24%), cotton (+23%), zinc (+20%), soybeans (+20%), and palladium (+18%).
Users can track sector-wise individual securities, indices, and funds on RADiENT. RADiENT can also be leveraged to compare and analyze securities/ funds against other securities and indices.

US Treasury 2-Year Yield
In March, the 2YR yield gained as much as 102bps before ending the month +90bps, its highest gain since May 1984.
Quarter 2 2022
Both shares and bonds were under pressure in the second quarter as investors moved to price in further interest rate rises and an increased risk of recession. Inflation continued to move higher in many major economies during the quarter. Chinese shares proved bright as prolonged lockdowns were lifted in some major cities.
The US in Quarter 2 2022
The S&P 500 continued to decline in the second quarter, hitting the lowest level since December 2020 (RADiENT). All four major stock indices posted negative returns for the second straight quarter, and like in the first quarter, the tech-heavy Nasdaq underperformed thanks to rising interest rates primarily while the Dow Jones Industrial Average relatively outperformed.

Users can track historical data for indices and securities on RADiENT.
By market capitalization, large-cap stocks again outperformed small-cap stocks in the second quarter, although the performance gap was small. The mid-cap stocks (-15.4%) outperformed the large (-16.1%) and small cap ( -17.2%).
In Q2 of 2022, both value and growth investment styles ran into losses, a departure from the first quarter where value posted a positive return. Rising interest rates, still-high inflation, and increasing recession concerns caused investors to continue to flee growth-oriented tech stocks and move towards more fairly valued sectors of the market, although again, both styles finished the quarter with negative returns.
RADiENT data shows that on a sectoral level, all 11 S&P 500 sectors finished the second quarter with negative returns. Relative outperformers included traditionally defensive sectors such as utilities, consumer staples, and healthcare were modest. Energy was also a relative outperformer thanks to high oil and gas prices for much of the second quarter.
US Fixed Income Markets
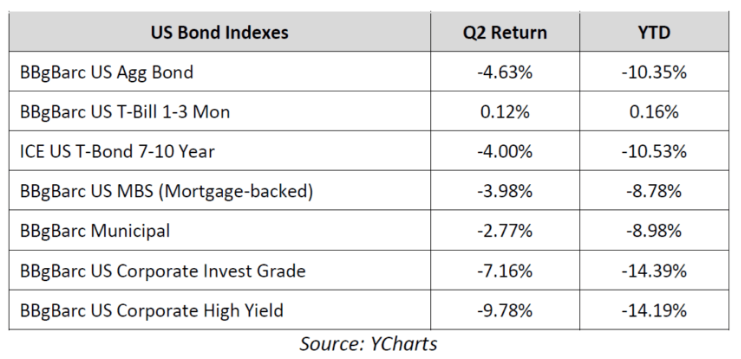
The Bloomberg Barclays US Aggregate Bond Index (Agg), which acts as a proxy for the investment-grade bond market, decreased by -4.7% in the quarter, bringing the year-to-date decline to -10.4%. Corporate bonds underperformed in the second quarter as rising recession fears and already-high inflation weighed considerably on corporate debt. Internet stocks weighed on the communications sector, while the stocks of consumer discretionary sector had bad earnings from several major national retail chains. Financials also lagged in the second quarter thanks to rising fears of a future recession combined with a flattening yield curve, which can compress bank profit margins.

US Treasury Bonds
Looking deeper into the bond markets, shorter-term Treasury Bills again outperformed longer-duration Treasury Notes and Bonds as high inflation and the threat of more than previously expected Fed rate hikes weighed on fixed-income products with longer durations. Short-term Treasury Bills finished the quarter with a slightly positive return.

References
https://www.schroders.com/en/insights/economics/quarterly-markets-review---q1-2022/
https://www.nasdaq.com/articles/march-first-quarter-2022-review-and-outlook
https://www.schroders.com/en/insights/economics/quarterly-markets-review---q2-2022/
