RADiENT dramatically simplifies asset manager workflows around investment decisions, due diligence, and industry research. The platform data is derived from various public sources and SEC-mandated regulatory filings. This data is updated daily.
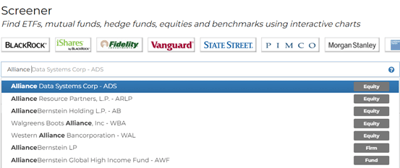
Users can find ETFs, mutual funds, hedge funds, equities, and benchmarks on the RADiENT screener.
What makes the RADiENT’s Screener the perfect tool for analyzing fund performance?
The screener has several measures and indices against which users can track the performance of funds. Users can measure and track various funds at the same time using the interactive charts and tables the screener offers.
Tool 1. Search for the funds/securities/asset classes or firms, using the search bar at the top of the page.
Tool 2. Specify the time period for which you would like to analyze the returns. When tracking at the firm level, users can also filter for the security type and currency.
Eg: At the firm level, the Radient screener shows the returns of 285 mutual funds and 92 ETFs with Vanguard for a 3-year period. Users can narrow down their search by opting to track either only the ETFs or mutual funds by clicking on the pie chart filter.
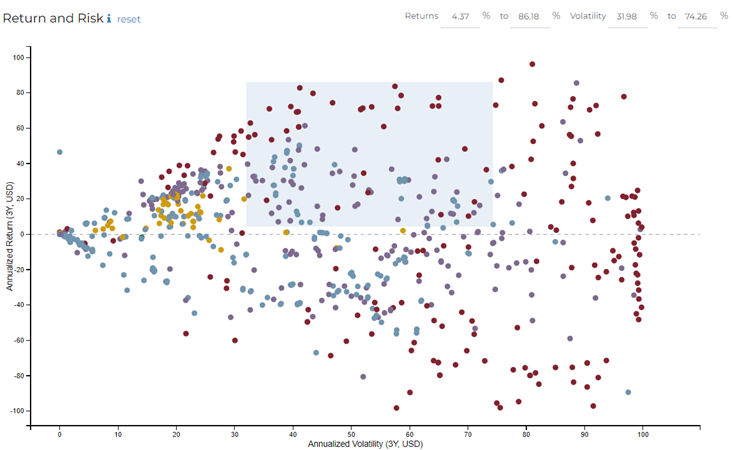
Tool 3. Set up Return and Risk filter.
It is a visual representation of the risk-return trade-off of all securities on RADiENT and helps to compare one against the other.
This interactive graph allows users to select the criteria specific range of return and volatility. Alternatively, users can also add the desired range to the returns and volatility scale that is present in the top right corner of the graph.
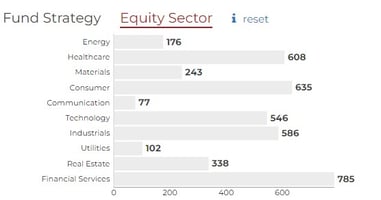
Tool 4. Users can filter for specific fund strategies by simply clicking on the column bar of the strategy. This tool also allows for sectoral filtration. Eg: You can select the Healthcare sector filter simply by clicking on its column bar.
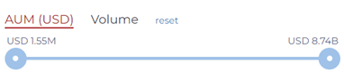
Users can also set an AUM range to narrow down on the funds within that range.
Tool 5. Performance Ratios
Users can drag to set the range of the ratios to narrow down on the funds falling within the specific criteria.
The performance ratios on the screen are:
Sharpe Ratio
Sharpe Ratio measures the average return earned by investment in excess of the risk-free rate per unit volatility. A fund or portfolio with a higher Sharpe is considered superior relative to its peers.
Sortino Ratio
Sharpe Ratio measures the average return earned by investment in excess of the risk-free rate per unit volatility. A fund or portfolio with a higher Sharpe is considered superior relative to its peers.
Largest Drawdown
The largest drop in cumulative return from a previously reached high (expressed as a percentage)
Tool 6. Style Filters
RADiENT style filters are calculated by performing multiple linear regression on a fund's returns against the returns of various indices for the selected time period. These filters include hedge fund indices by Credit Suisse, Eurekahedge, EDHEC, and HFRI, and other global equity indices, US equity indices, and US sector indices.
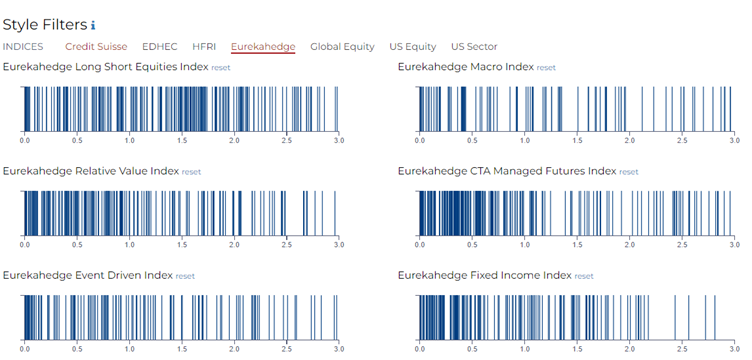
These index filters are also draggable i.e. users can set a specific range to analyze the funds that fall within this range.
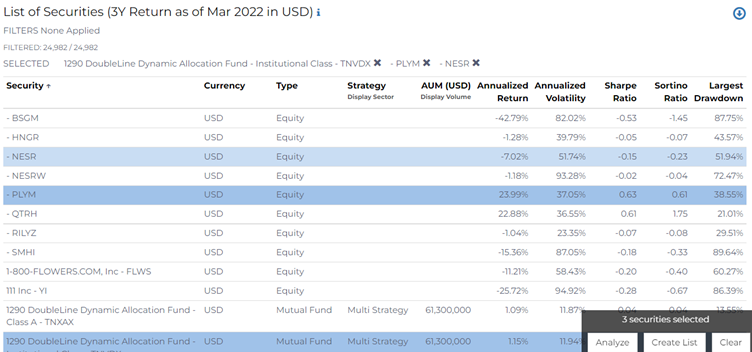
Tool 7. List of Securities
At the end of the page, there is a table labeled ‘List of Securities’. This list is also influenced by the specific filters that the user may select on the screener, therefore users can leverage this list to analyze multiple securities at the same time or create a list that can be saved and tracked easily in the future.
This RADiENT feature enables easy peer comparison and helps increase user focus on the performance ratios and returns of select securities with significantly reduced complexity.
To know more about the platform and its features, write to us at support@radientanalytics.com