On the 24th of February Russia launched a full-scale invasion of Ukraine. This war has hammered global financial markets and fuelled concerns about run-away inflation as oil prices skyrocketed in the wake of tough western sanctions against Russia, a top commodity exporter.
Global Financial Markets
All major global indices experienced a sharp sell-off from the start of the invasion to mid-March. All three of the major U.S. stock indexes started March lower, following the European Stoxx 600. For the month of February, the S&P 500 fell over 3%, the Dow lost over 3.5%, and the Nasdaq dropped 3.4%.
By March 10th, indices such as MSCI Inc., S&P Dow Jones Indices, and FTSE Russell decided to nick Russian stocks from global stock benchmarks at a price of “zero” or “effectively zero” after consulting with market participants. There are more than 250 S&P indexes that were affected by this change. Russian assets were deleted from more than 9,600 indexes at MSCI.
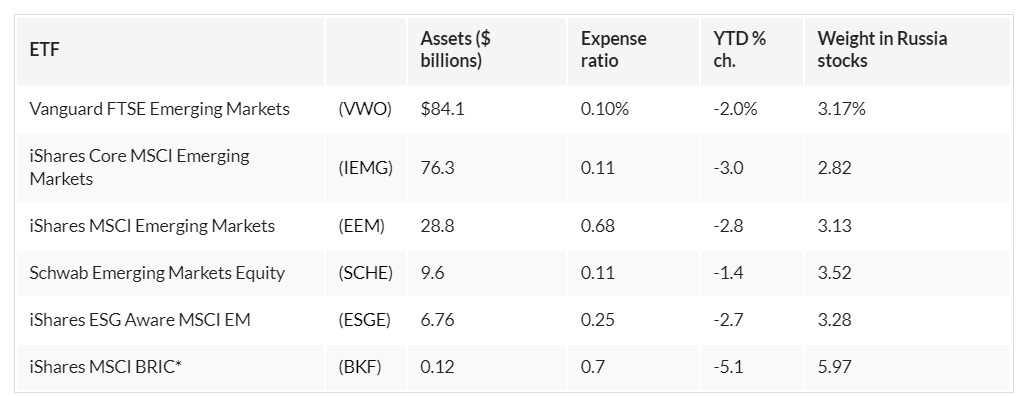
You can track the reactions of Emerging market providers such as (IEMG) iShares Core MSCI Emerging market ETF and (VWO) Vanguard FTSE Emerging Markets ETF.
Some of the Top Emerging Market ETFs with Russian Stocks
( as of 24th February 2022)
As peace talks between Russia and Ukraine progress, markets have been showing signs of improvement. Asian markets joined a global rally, MSCI's broadest index of Asia-Pacific shares outside Japan rose 1%, and touched its highest level since March 4, with most Asian stock markets in positive territory. On the flip side, Japan’s Nikkei fell 1%. The Bank of Japan increased its efforts to defend its key yield cap on Wednesday (March 30) offering to ramp up buying of government bonds across the curve including through unscheduled emergency market operations.
On March 29 at the close of trade, the Dow Jones Industrial Average index advanced by 338.30 points or 0.97%. The S&P500 index grew by 56.08 points or 1.23% and the tech-heavy Nasdaq Composite Index was up 264.73 points, or 1.84%.
European shares rallied following the paths of US and Asian markets. As of March 29, the pan-European STOXX 600 index climbed 1.6% to its highest in nearly a month, and extended gains to a third straight session, as a sell-off in bonds continued. All major sectors were in positive territory.
Oil and Energy Sector
Russia is the world's second-largest crude producer and provides around 35% of Europe's and 50% of Germany's natural gas supply.
The economic sanction against Russia makes it difficult for the country to export crude oil, and as result oil prices surged. In the first week of March, Oil jumped to $139 a barrel at one point, the highest level for almost 14 years.
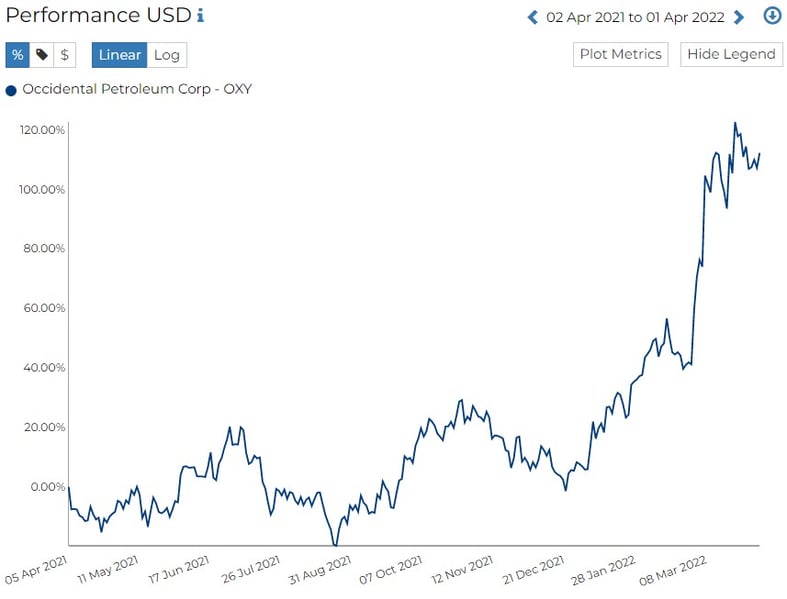
The Energy Select Sector SPDR Fund (XLE) hit highs not seen since 2018. Van Eck Oil services ETF (OIH), which holds shares of Schlumberger, Halliburton, and other oil service providers, also made its way back to the pre-pandemic highs. OIH is currently trading at $281 as compared to $242 as of 24th February 2022. By mid-March, Exxon Mobil was this year’s top contributor for the Morningstar U.S. Market Index, rising about 35.3% year-to-date. Its competitor Chevron (CVX) gained 25.6% since the war started, and was up about 36% for the year. The oil exploration and production firm Occidental Petroleum (OXY), which made up a smaller portion of the U.S. market index compared to Exxon and Chevron, is up nearly 94% this year. Occidental Petroleum saw a sharp rise in its price on the 28th Feb at $43.6 from $38.6 on the 25th Feb. OXY’s price peaked at $60.9 on the 21st of March 2022.
Users can track similar oil companies on RADiENT!
After the peace talks between Russia and Ukraine, oil prices shed $3 a barrel.
Oil Centric Funds in the US
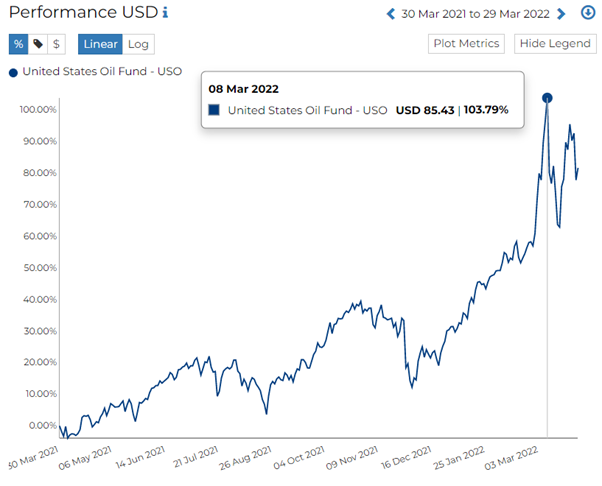
- (USO) United States Oil Fund
With total assets worth $3.4B, witnessed its peak at $85.43 on 8th March 2022. The fund reports an annualized return of 80.1% for the year 30 March 2021 to 29 March 2022.
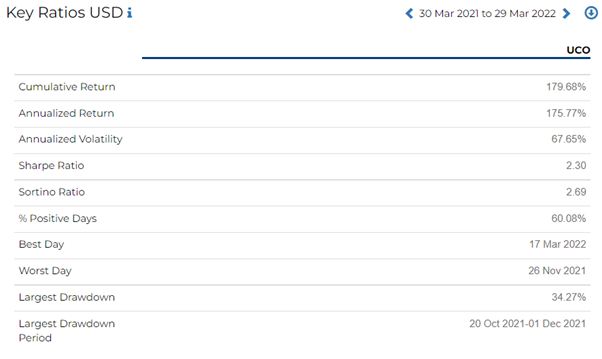
- (UCO) ProShares Ultra Bloomberg Crude Oil
ProShares Ultra Bloomberg Crude Oil was one of the levered ETFs returning more than 11% in the last week, as oil prices gained on global supply chain disruption and a sanction on Russian fuels by the western countries. UCO has total assets worth $1.3B with an annualized return of 175.7%. The fund peaked on 8th March 2022 at $193.82.
More crude oil ETFs on RADiENT:
- (DBO) Invesco DB Oil Fund, with total assets worth $504M
- (SCO) ProShares UltraShort Bloomberg Crude Oil, with total assets worth $407M
- (OIL) iPath Pure beta Crude Oil ETN, with total net assets worth $187M
- (USL) United States 12 Month Oil Fund LO, with total assets worth $144.7M
Funds that are Over-Exposed to the Russia-Ukraine War
The VanEck Russia ETF – Net Assets of $692 million
(as of 2/28/2022)
This ETF was down 60-70% in the first few weeks of the war. RADiENT data shows that the ETF was trading at $5.65 on 4th March 2022, the day the Chicago Board Options Exchange decided to halt the fund’s trading. RSX saw a fall of 78% in its price within 10 days.
Blackrock iShares MSCI Russia ETF – Net Assets of $105 million (as of 2/28/2022)
Trading of ERUS was also halted on the 4th of March 2022 at $8.06, falling nearly 80%. Some of the largest holders of this ETF include BlackRock, JPMorgan BNY Mellon, and the State of New Jersey Common Pension Fund.
Other funds that have been affected by the war include:
- Rowe Price Emerging Europe Fund (TREMX)- Net Assets of $146 million (as of 1/31/2022)
- Morgan Stanley NextGen Emerging Markets Fund (MFMIX)-Net Assets of $122 million (as of 2/28/2022)
- Schwab Fundamental Emerging Markets Large Company Index ETF (FNDE)- Net Assets of $4.8 billion (as of 2/28/2022)
US Debt Funds Affected by the Russia-Ukraine War
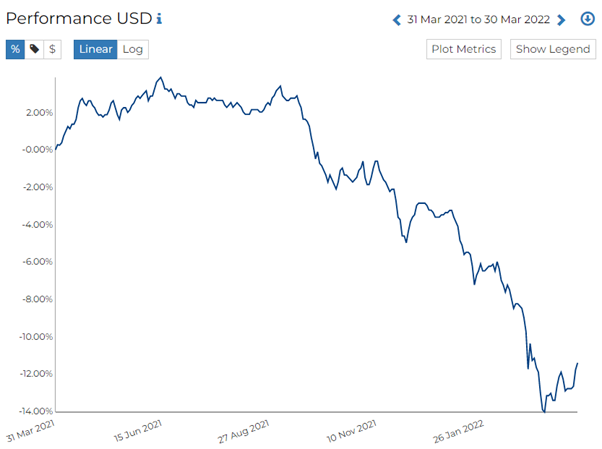
(TGEIX) TCW Emerging Markets Income Fund
This fund has had little exposure to Russia in recent years but has been overweight Ukraine in a mix of USD-denominated sovereign and corporate debt. The fund cut its 0.7% in USD denominated Russian sovereign debt and 2.3% in Ukrainian USD denominated sovereign and corporate debt as of Feb. 23, to nothing and 0.7%, respectively, by March 2, 2022.
RADiENT data shows that the fund saw its lowest ever price on the 7th of March 2022 at $6.8. Currently, TGEIX has an annualised return of -11.25%. The fund’s last Form NPORT discloses a market value of $7.5B as of 16th Dec 2021.
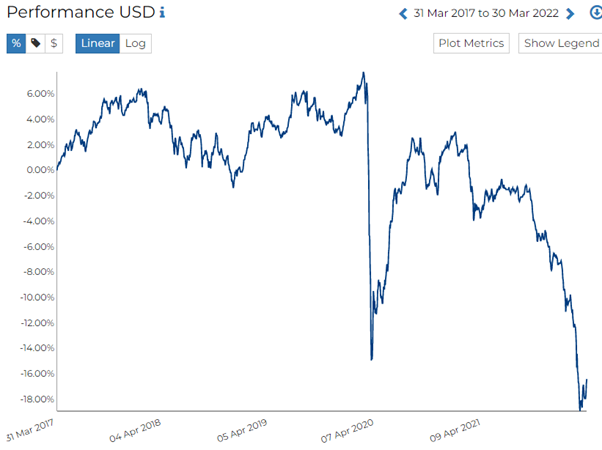
(PEBIX) Pimco Emerging Markets Bond
Pimco Emerging Markets Bond (PEBIX) has been moderately overweight by Ukraine securities. The team hedged this with underweight in Russia and a tactical Russian Ruble short. According to RADiENT data, PEBIX was hit its lowest in 5 years on 8th March 2022 at $8.99.
(PYLEX) Payden Emerging Markets Local Bond
PYLEX’s total exposure to Russian and Ukraine debt is 9.45%. RADiENT data shows that the fund was at its lowest on 8th March at $4.95 from $5.64 as on 17th February 2022. The fund’s last Form NPORT discloses a market value $42M, with one of its largest addition for the period being in debt issued by the Ukraine Government.
More Debt Funds Domiciled in the US with large exposures to Russia and Ukraine :
- (TGWIX) TCW Emerging Market Local Currency Income Fund
- (MEDIX) MFS Emerging Markets Debt
- (IMCDX) Voya Emerging Markets Corporate Debt
- (EBNAX) American Funds Emerging Markets
- (PEMIX) PIMCO Emerging Markets Corp
Track the updated daily performance of funds and securities on RADiENT!