Searching for funds can be a daunting task, especially selecting funds with desired return characteristics or filtering on specific criteria. RADiENT Fund Explorer is designed to help you find the best funds easily using visual interactive graphs.
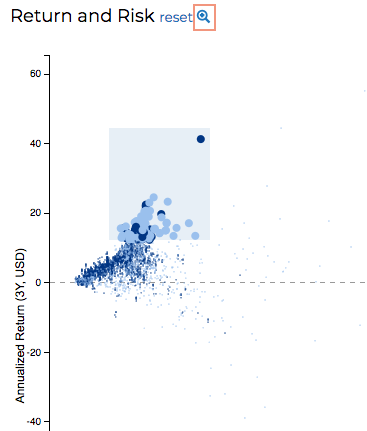
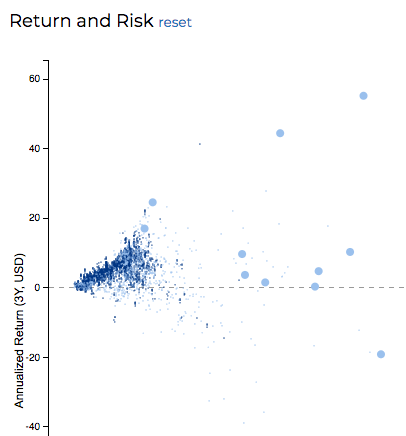
First, the Return and Risk chart provides a visual guide to the payoffs offered by all funds on RADiENT. As a result, it also makes outliers easily identifiable. For a closer look at a security's return and volatility, you can highlight an area on the graph with a simple brush selector, and click on the magnifying glass to zoom in.

This lets you pinpoint funds with high return but relatively lower risk, such as the Science and Technology Trust - BST (Return: 24.59%, Volatility: 16.13%). You could also consider a fund like John Hancock Variable Insurance Trust Emerging Markets Value Trust - JHVTX depending on your risk preference since it has high return at 41.34% but with more volatility or risk - 25.74%.
Second, you can use the Fund Explorer to differentiate funds with similar profiles and volatility but offering varied returns - these are highlighted on the graph below. In such a situation, more often than not, the better investment option is the one with the higher return. Here, the top fund in the list is BlackRock Technology Opportunities Fund - BGSIX with a 22.48% return.

Third, our Styles Betas measure the dependency between a fund's returns and relevant market and sector indices. Using them, you can effortlessly spot funds that experience a greater degree of fluctuation due to market movement. Pick from a variety of US equity sector indices or Global market indices. The example below shows funds highly correlated (beta between 1 and 3) with the Information Technology sector in the US. Similarly, you can funds that are correlated with US Health Care stocks or even Japanese stocks with the Nikkei style beta.

↓

So go ahead and give it a whirl! Discover new investment opportunities for your portfolio using RADiENT's Fund Explorer.

