2021 brought hope for global economic growth following 2020’s covid caused downturn, largely tied to the development and widespread deployment of COVID-19 vaccines. In this blog, we take a look at the performance of macro-economic indicators and broad indices, and other important events of 2021.
World Economy
The world economy stabilized in 2021 after the global lockdown of 2020. The IMF estimated that global gross domestic product grew 5.9 per cent in 2021 after the 3.1 percent decline that total GDP suffered in 2020.
Global Indices
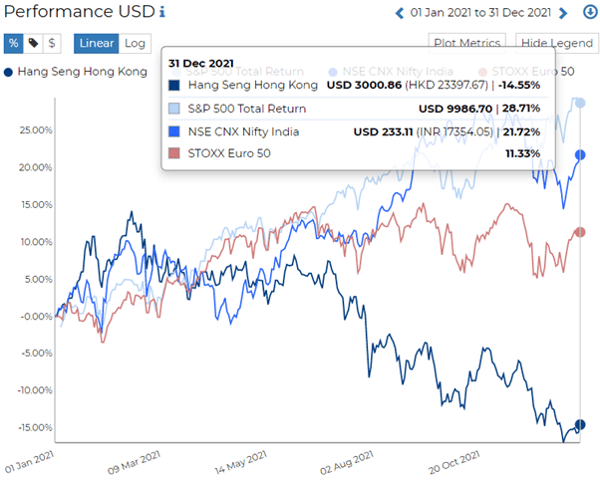
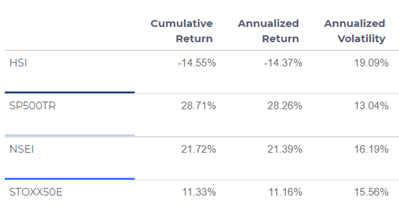
RADiENT data shows that as of 31st December 2021, from 4 major global indices, the S&P 500 TR Index closed the highest, followed by Nifty India.
Europe
In the year 2021, Europe also witnessed strong economic recovery the IMF forecasts showed GDP growth of 5 percent in the Euro currency area and 6.8 percent in the post-Brexit UK. However, the continent witnessed shortages in the energy markets that caused gas and coal prices to soar to an all-time high.
China
For China, the year was distinctly mixed. “The IMF forecast GDP growth of 8 percent in 2021 — almost back to the staggering levels that drove world economic progress in the first two decades of the century — but “the momentum is slowing,” the IMF warned, projecting a GDP growth rate of 5.6 percent in 2022.” Throughout 2021 experts were concerned that the Chinese economy was retreating from its role as a global economic stimulus. “Experts such as Ian Bremmer, president of the Eurasia Group consultancy, warned that China’s retreat from US stock markets and other forms of commercial cooperation in technology with the US and the rest of the world was problematic for the global economy.”
Global News
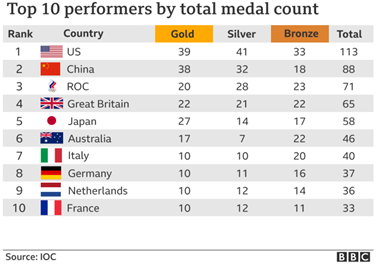
- July 2021 brought the 32nd Summer Olympic games to Tokyo, a year after being postponed. The U.S. topped the medal count with 113.
- August saw the withdrawal of American troops from Afghanistan after a two-decade war
- In 2021, NFTs became one of hottest tech trends. On November 24, Collins Dictionary named NFT its “Word of the Year”. Q1 began the NFT boom, starting primarily with centralized projects including NBA Top Shot that began skyrocketing around February and March. By March 2021, not only were volumes ramping up, but creators began establishing substantial identities online for their work as well; digital design artist Beeple was making major headlines, selling his Everydays NFT for a record-shattering $69M – the eighth-most expensive artwork sold in 2021.
Growth in the US
For the world’s biggest economy, the US, the reversal has been even more notable — from a 3.4 percent decline in 2020, the economy grew by nearly 6.5 percent in 2021. According to the Bureau of Economic Analysis, the real GDP of the US grew at an annual rate of 2.3 percent in Q3 2021 followed by an increase of 6.7 percent in Q2.
- In 2021, traders’ and investors’ interests in cryptocurrency grew exponentially. The market cap of all cryptocurrencies topped $3 trillion globally in 2021, as Bitcoin and Ethereum soared to record highs, but experienced intense volatility. Meme-coins, including Dogecoin and Shiba Inu, became mainstream as they racked up astronomical gains, spurred on by business celebrities such as Elon Musk and online trading forums like r/wallstreetbets.
- “Retail traders tilted the playing field against traditional Wall Street institutions in 2021 as day-trading enthusiasts swarmed stocks targeted by institutional short-sellers and hedge funds, driving stocks like AMC Entertainment (AMC) and GameStop (GME) to extreme highs, prompting short squeezes and hundreds of millions of dollars in losses for legacy institutions.”
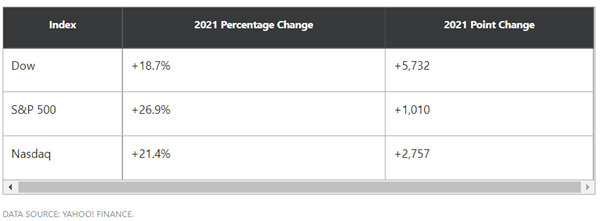
- The US capital markets have stayed pretty consistent throughout 2021, despite economic uncertainty, the ongoing pandemic, and a sense of frothiness across many asset classes. The S&P 500 closed at record highs more than 67 times this year. Meanwhile, several of the biggest stocks got bigger as Tesla (TSLA) joined the Trillion Dollar Market Cap Club and Apple (AAPL) danced dangerously close to the $3 trillion apex. Because of the exemplary performance of such tech companies, the U.S. equity markets outperformed all developed global markets for the fourth year in a row.
Fastest growing tech stocks of 2021
Upstart, a developer of technology to spur online lending, grew more than 250% this year, following the company’s IPO in mid December last year
The company’s revenue inQ3 2021 soared 250% to $228M. Additionally, Upstart has generated earnings for five straight quarters. Upstart now provides technology services to 31 banks and credit unions, up from 10 a year ago. In Q3, the company powered 362,780 loans, up 244% from a year earlier.
With two straight quarters of revenue growth above 30%, Fortinet is expanding at its fastest rate since 2016
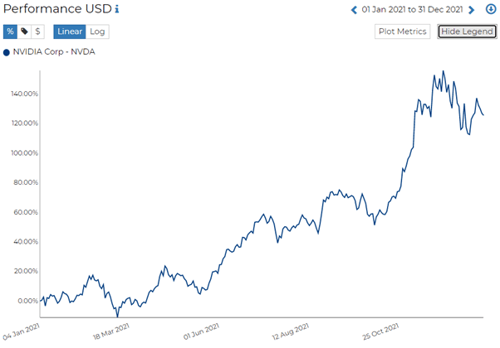
Chipmaker Nvidia was the best-performing mega-cap tech stock of the year. Its shares soared 127% in 2021, pushing the company’s market cap to $741B, seventh-highest among U.S. tech companies, behind the five Big Tech names and Tesla.
ETFs
Investors showed little interest in ETFs in 2021. According to Factset’ “Actively managed ETFs captured 10% of net inflows, despite comprising only 3% of assets at the start of the year.”
Private Markets
According to David Kremski, VP, Director of Private Markets’ “Globally, private market deal activity rebounded significantly in 2021 as investors adjusted quickly to the global pandemic. Specifically, venture capital (VC) total deal value more than doubled 2020 activity, with deals totalling $595 billion (through mid-December) vs. $290 billion in 2020. PE/VC dry powder remained at record levels, and over 700 private companies passed the $1 billion valuation mark (unicorn status) as compared to 275 in 2020.”
Bond Market
US 10-year Treasury yield finished 2021 above the 1.5% threshold in a year. The 10-year yield started the year at 0.91%. The yield hit a high of 1.776% in March. Additionally, five-year yields surged from 0.36% to 1.26%. Those moves showed anticipation of rate hikes in the near future.
Major Market Benchmarks for the year 2021
SPACs
According to Pitchbook, 317 SPAC IPOs were launched in the first quarter of 2021, 106 in the second quarter and 111 in the third quarter. Now, there's a rising trend in deals getting cancelled. Eight SPAC mergers have already been called off since the beginning of Q4 2021, compared to seven terminations for all of Q3, none in Q2, one in Q1. Some of the largest mergers of 2021 are Joby Aviation, We work and Polestar
70% of SPAC IPOs so far this year are trading below their $10 offer price (that's through September 15, and includes those that have announced and a few that have completed mergers). And of the SPACs that have completed mergers in 2021, 58% trade below their original offer price”
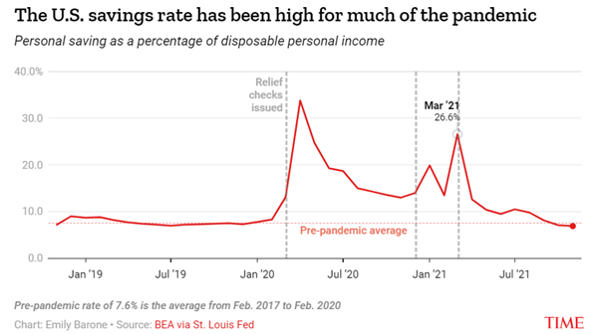
US Savings Rate
According to Time, dampened consumer spending along with relief checks and unemployment benefit schemes triggered the personal savings rate to shoot up in 2021.
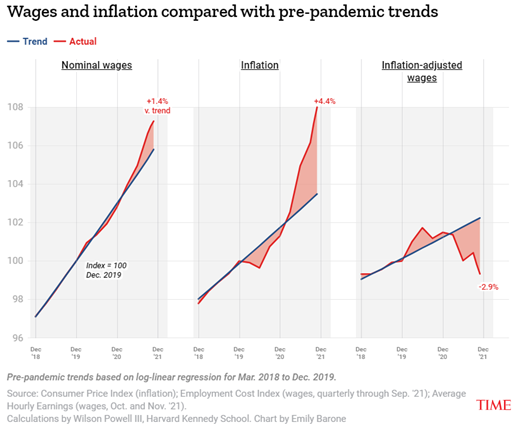
Inflation and Earnings by Industry
Economic recovery also brought historic spikes in producer and consumer prices, large labour shortages across industries, and a global supply chain clog that persists today.
Energy prices are a major reason why inflation has spiked. The World Bank announced in late October that energy prices are on track to be more than 80% higher in 2021 compared to 2020, and will stay high in the first half of next year, posing a significant risk to global inflation.
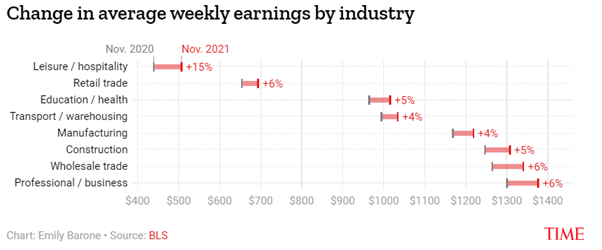
Prices for goods and services were running high. Wages and salaries for private industry workers were up 4.6% for the 12-month period ending Sept. 2021. But U.S. inflation 5% annual increases every month since June, which means that the price increases have eaten into the salary gains for much of the year.
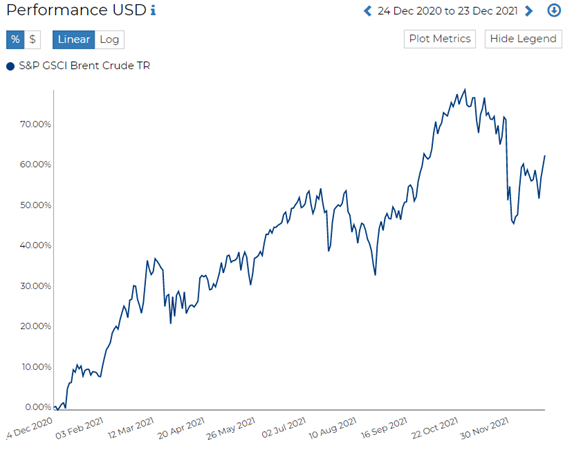
Energy Inflation
Energy prices used in the S&P Goldman Sachs Commodity Index (GSCI) ended 2021 59% higher than the first trading day of the year. The GSCI is a commodity index that tracks the performance of global commodities markets. Prices in energy commodity futures markets greatly increased throughout 2021. The futures price of RBOB (a reformulated grade of gasoline used as the benchmark for gasoline trading) increased by 67% and ULSD by 64% during 2021. The only commodity included in the GSCI that increased more was coffee, whose futures price increased by 81% during 2021.
Several factors contributed to the higher energy commodity prices throughout 2021, including weather disruptions, increased demand for gasoline and diesel; and increasing demand for crude oil and natural gas at a rate faster than increased production.
ESG
Investors concerned about climate change and social justice had a bumper year in 2021, successfully pushing companies and regulators to make changes amid record inflows to funds focused on environmental, social and corporate governance (ESG) issues.
A record $649 billion poured into ESG-focused funds worldwide through Nov. 30, up from the $542 billion and $285 billion that flowed into these funds in 2020 and 2019, respectively. ESG funds now account for 10% of worldwide fund assets.